Google Body Browser

This new site, created in partnership between Google and Zygote Media Group, is an interactive anatomy showcase, with intuitive controls allowing you to explore the male, female, and bovine figures.

Two screenshots from Google Body application

By clicking different mouse buttons and dragging, you can zoom in and out as well as rotate.  On the left of the interface, there is a slider that changes the opacity of the different types of tissues (meaning Skin, Muscles, Bones, Abdominal Organs, Cardiovascular, Lymphatic, and Nerve/Brain), so that you can see what is underneath.  For ease and simplicity you can change them all at once, or each group of structures can have an individual slider.

On the right, there is another, much more complicated series of buttons.  The first of these allows you to click to highlight, meaning that other anatomy will fade, and whatever you clicked will be in full color with the name appearing below it.  The next option is to “Pin” the structure, which leaves the name visible while you do other things.  A flashlight icon lets you highlight the pinned body parts by fading out the rest, and an eraser removes all of the pins.  The next group of controls allow you to hide body parts by clicking on them.  Somewhat counterintuitively, another “eraser”-like icon undoes all of the hiding.

A pencil icon allows you to make notes that remain visible in the upper right area, and can be edited.  This is very useful: you can use a link icon to get a link to the exact settings you have created (even the notes re-appear), which could be like a way to save your work, if you were using the application to study or teach, and had multiple pinned structures, etc.  The obligatory social networking icons are present: the notes you wrote can be shared via Google Talk and Twitter.

The last feature is perhaps the most useful to students (and medical illustrators!): it allows you to choose the structure you want to see from a list, highlights it for you, and even zooms in to give you the best view of it.  The choices are as general as “Left side” and get as specific as “ACL.”

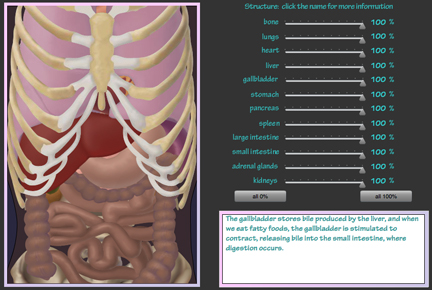
All in all, a pretty awesome resource.  I did a similar project last year, where-in you can change the opacity and highlight different structures.  But it’s not 3D, and it’s only a human abdomen, no cow option.  Still, it’s pretty and it did what I meant for it to do, which was to give me practice implementing sliders in Flash and ActionScript 3.  You can see it at  http://www.luthermultimedia.com/interactivepages/inVisible.html

from the interactive "inVisible Anatomy"

A pencil drawing for a change of pace and a better world

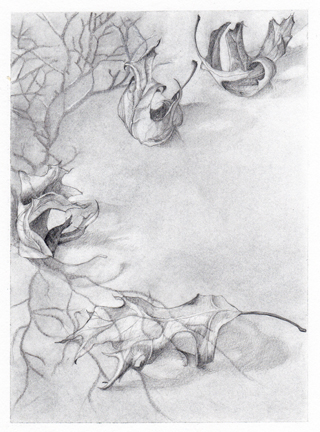
Every year, Mr. Saad Ghosn publishes a book entitled “For a Better World, Book of Poems and Drawings on Peace and Justice by Greater Cincinnati Artists.”  He asks the artists what kind of poetry they like, and then pairs them up with a few different poems to illustrate.  This year the book is in its eighth edition, and I am excited to be contributing this drawing…

Pencil and charcoal on paper

It goes with a poem that uses trees as a metaphor to liken dreams, family, and memories to the life/growth/death/new life cycle (at least, that was my interpretation) by Kathryn Martin Ossege. It’s been a while since I did a nice complete drawing without any software component, and I forgot how relaxing it was.  I look forward to the book coming out and getting to see all of the other drawings and poems that were contributed.

Live cell 3D microscopy

Accuracy is important to medical illustrators’ work.  But what if you cannot see the subject matter you are drawing?  I love illustrating the world of the cell, so I am always on the look-out for new resources and references that can show me what cells and intercellular structures actually look like.  I recently heard about a new microscope that can create 3D movies of live cells.  Located at the Howard Hughes Medical Institute, this microscope uses what is known as a Bessel beam, a band of light which scans rapidly through live cells, capturing images (200 per second) that can be stacked together to show the 3D structure.  See the full article at http://www.hhmi.org/news/betzig20110304.html.

Because this technique does not require the cells to be fixed and stained, nor does it kill them by over-exposing them to too much light, their structure can be examined over time, showing their membranes and organelles moving.

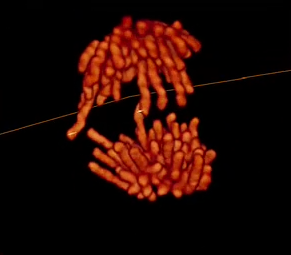
For example, one such movie shows the chromosomes separating over the course of 18 minutes, in preparation for cell division (still image shown below).

Mitosis (screen shot from video at http://www.hhmi.org/news/popups/mitosis_mov_pop.html)

This research was carried out at HHMI’s Janelia Farm Research Campus, where one of their research focuses is the development of imaging technologies and computational methods for image analysis.  Some rainy day, I’ll have to browse their archives and catch up on the latest developments in microscopy.

Iris sketch

The Iris

This is a sketch for a piece that is going in a brochure about eye surgeries.  The iris is a very complicated structure!  The underside is lined with epithelium, the middle contains two muscles (a dilator and a contractor to change the size of the pupil), many tiny blood vessels, and above that, the layer everyone thinks of when they think of the iris, with the wavy lines and little freckles.

I am trying a new technique, wherein I print out the overall design and outlines of the shapes, and then add details with pencil and scan them in to become part of the final work.  We’ll see how it goes!

If possible, I will post the final version, in color.

New resource: “The Cell, An Image Library”

This interesting website was recently brought to my attention –

The Cell: An Image Library  <http://www.cellimagelibrary.org/home>(tm) is a new research-, reference-, and education-focused cell image, video, and animation repository. An open-access resource for peer-reviewed images and their raw data, The Cell will help researchers share and archive their data. It will create a common file format for use by all. And its growing contents will be easy to search.

Well, that sounds exciting, right?  Let’s take a look.

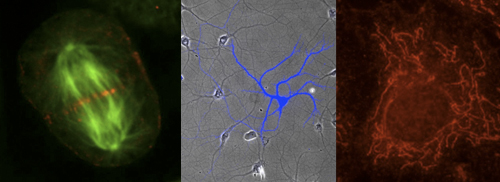
Images from "The Cell" website: mitosis, a neuron, and red mitochondria

The site features images, videos, and animations that are categorized into Cell Process, Cell Component, Cell Type, and Organism.  Within each category, content is sub-categorized.  For instance, the Cell Process tab contains such topics as “Locomotion,” “Cell Cycle” etc.  Clicking on “Locomotion” will bring you to a series of images with a description that you can click on to see a larger version of the image, as well as a detailed description of what is happening in the picture and how the scientists obtained the image.

Because of my obsession with scale and size, (link takes you to my Master’s research project interactive) I was happy to find that the size of the image and the number of micrometers or nanometers represented by each pixel was listed on the lower right of the page.  Plus, within the page you can zoom in on the image using the mouse wheel.  There is an option to download a TIF file of the image, and many are in the “public domain” meaning that users can legally download them and use them for any purpose, though of course they remind you that it is best to give credit where credit is due.

Maybe I’m just not seeing something, but I don’t know how I can tell ahead of time if I’m going to see a video or still photo when I click on one of the topics.  That is my only minor gripe.  All in all, I think it makes a wonderful reference for medical and scientific illustrators.  In fact, a molecular animator, Janet Iwasa (of Harvard Medical School) is on its team as a co-principle investigator.

Here are two other publicly accessible sites with a wealth of scientific information with an emphasis on visualization:

  • the Protein Data Bank for proteins (obviously): displays proteins and other molecules 3-dimensionally as ribbons, ball-and-stick models, etc.
  • the Kyoto Encyclopedia of Genes and Genomes: simple but informative biological process diagrams, such as the one below.

    A screen shot from KEGG